Coastal Mapping
and Ranking
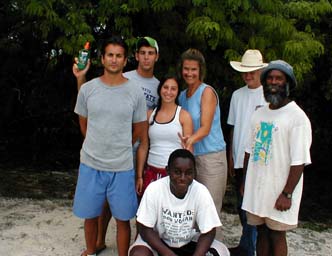
LESTER FLOWERS: (Nassau, Bahamas) was responsible for shore profile data analysis and plant identification. He is a senior lecturer at College of the Bahamas, and P.I. for the Coastal Ecology Project.
RYAN BOGGS (Seneca,
South Carolina) was responsible for profile and Zip level measurements. He
helped with the survey summaries and data entry.
AUSTIN BARNES (Halsey, Nebraska- Sandhills) was responsible for the shore
profiles and Zip level measurements. He helped with the overall survey
summaries and data entry.
CARLY FURMAN (Short Hills, New Jersey) was responsible for the plant surveys and plant data entry. She also helped with pressing plants, and maintaining the plant log.
KIRKLAND SMITH (Nassau, Bahamas-Adelaide Village) was responsible for plant surveys and tree identification. He maintained the plant log and specimens of unknown plants. Kirkland really enjoys composting and organic gardening. He wants to become a botanist.
DAVE SANFILIPPO (Reading, Pennsylvania) was responsible for shore profiles and ground water wells and cores.
Our overall goal is to document and disseminate information on the diversity and status of the coastal zone in and around Elizabeth Harbour, Great Exuma.
The research objective is to evaluate the impacts that humans have had on the coastal zone. Many sources of water pollution are located and mapped, such as septic tanks, buildings, or farms. Special attention will be paid to mapping these potential sources for coastal water quality degradation. Even uninhabited islands can have some exotic plant invasions or sand mining. A “scorecard” has been developed to estimate the type of alteration, approximate age, and potential source activities that may impact the marine environment. Satellite imagery will provide information on the nature and extent of vegetation types, but manpower and detective work is needed to determine the scale of human impacts. Some costal developments have had massive effects resulting in the complete reshaping of the shoreline, and historical aerial photographs may be the only way to “reconstruct” what was once there. This objective will require some interviews with residents and local government.
The theory is that diversity on land supports diversity in the near shore communities. Studies over the past two years have shown that when there is an intact coastal vegetation community, there is likely more diversity in near shore algae. These algae are critical food and shelter for near shore marine fishes and lobsters. The coastal survey will consist of both land and sea components. Our team focused on the land components: 1.) shore profile to document topography and elevation, 2.) plant community surveys, and 3.) coastal ranking through completing a scorecard of human impacts.
METHODS:
Shore Profile
a rough sketch of the transect is made to indicate zones. Additional information including weather conditions, A GPS location (waypoint) is taken for future monitoring of the transect site. The fieldwork is complete after this entire procedure is finished. At the end of the day the data is entered onto an EXCEL spreadsheet on a computer in the Exuma Educational Resource Centre (EERC).
Typical Rocky Shore Zonation
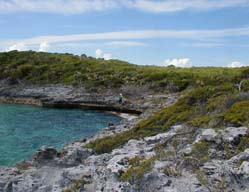
Consolidated sediments are rocky shores are common in the Bahamas. At the water line rocky shore are grey or black. The rocks are very porous. The shorelines are locally called “iron shores”. There are distinct zones up from the water line starting with the rocky shore, bluff and ridge. The rocky shores can be low relief (less than 4 meters from mid tide line to ridge) and high relief (greater than 4 meters).
Typical Sandy Shore Zonation
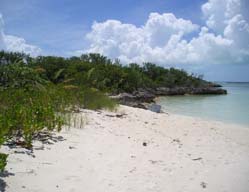
Unconsolidated shorelines are beaches. Depending on wave energey, beaches can vary in width and height of the dunes. Shore profiles on beaches begin at the high tide mark, and are characterized by distinct zones. Starting from the water, there is a sparsely vegetated pioneer zone, a grassy or shrubby foredune, back dune, and then swale.
Plant Community Survey
Previous research has produced a checklist of 206 common coastal plants. These plants are identified as grasses, herbs, shrubs, trees or vines. The plant team walks the survey line and determines which plants occur in each zone along the transect (within 5 meters of the transect tape). A plant survey helps to study the biodiversity of different plant species within an area.
After a list of the conspicuous coastal plants is generated, the survey team assigns an abundance code to each plant in each zone. It is also necessary to mark down which zone each plant is located in. Some species are found in different zones. Occasional plant species cover less than 10% of the ground area. Common plants cover from 10 to 70% of the ground area, and an observer would certainly see that species upon visiting the site. Abundant species dominate the ground cover (>70%). In the data recording, these abundance values are given a numerical ranking of 1, 2 and 3 respectively.
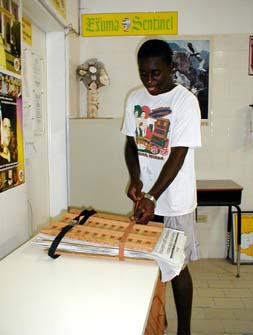 Kirkland Smith pressing plants collected from a survey to be identified
Unknown plants were collected to be later identified. The unknown plants are preserved by pressing. Plants specimens are trimmed and then placed between newspapers between blotting paper and stiff cardboard. All plants are properly documented by recording:
· - who collected the specimen,
· - when and where it was collected, and
· - a log number to track the specimen.
Plants are tightly strapped in a plant press. The pressed plants are put in an oven to dry them out, which will prevent rotting or decomposing. The dry plants are glued onto herbarium paper and sent to a botanist to identify. Additional log information includes the date, site, zone and description.
Four factors are used to determine the impact of human activity on the entire coastal segment at a transect. Each factor is scored on a scale… each of the following factors are scored on a scale from LOW to SEVERE. These factors are listed below in order with the first factor being the most significant impact.
Following the scoring of the above impacts an overall ‘Coastal Ranking’ is assigned to each segment. Seventeen (17) coastal segments were ranked in accordance with the above criteria.
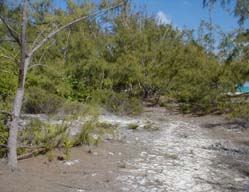
 Fowl Cay with a low ranking of
human impact. Fowl Cay has very low damage to the area with very little physical
restructuring.
Fowl Cay with a low ranking of
human impact. Fowl Cay has very low damage to the area with very little physical
restructuring.
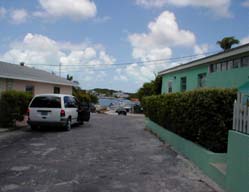
 Hoopers Bay with a medium
ranking of human impact. Hoopers Bay has a medium ranking of physical
restructuring, destructive use, and coastal development. It is scored low for
invasive plants.
Hoopers Bay with a medium
ranking of human impact. Hoopers Bay has a medium ranking of physical
restructuring, destructive use, and coastal development. It is scored low for
invasive plants.
 Administration Building site
with a high ranking of human impact. The Administration Building is ranked high
with destructive use, and coastal development. It is scored low in physical
restructuring and invasive plants.
Administration Building site
with a high ranking of human impact. The Administration Building is ranked high
with destructive use, and coastal development. It is scored low in physical
restructuring and invasive plants.
Victoria Pond with a severe ranking of human impact. Victoria Pond is ranked medium in physical restructuring, and destructive use. It is scored high in invasive plants and serve in coastal development.
A summary table presents all the sites surveyed on Great Exuma. 22 sites were surveyed between 13 July and 4 August 2004. Most of the sites are ranked low impact.
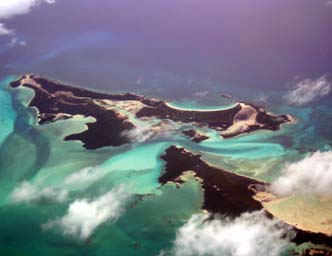
One of the Earthwatch teams’ goals in the Bahamas was to map and analyze different parts of the Exuma Islands. The land surveying team was put in charge of mapping by dividing the landscape into transects. The transects served to ground-truth initial characterization of the coastal landscape from Land Sat 7 imagery.
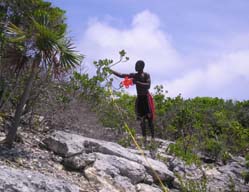
The land surveying was a difficult and hot task. Usually five to six people were needed to complete the survey in 60 to 90 minutes, depending on the length of the transect and thickness of the vegetation. Each member of our team was assigned a specific job. Expertise was needed in plant identification and use of the zip level. In summary, experienced team members were needed to train and assist students, and this was not an easy methodology. The information obtained can be very important in the assessment of coastal biological diversity, but the same methods would need to be followed to repeat surveys for monitoring.
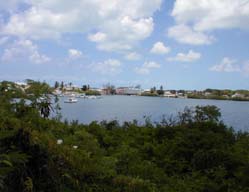
The surveys focused on islands around Elizabeth Harbour as well as sites along the southeastern shores of Great Exuma. Sites were very different not only in topography (rocky vs. sandy, or high relief vs. low-relief). It was interesting for the team to see the variety of coastal land uses, and range of human impacts. At the end of the day, a careful review of the data was necessary to identify missing data, or mis-recorded information. The biggest challenge for the team was to keep up and maintain electronic data records at the end of a long day in the field.
We were particularly interested in the impact of humans on the sites and the affect of exotic plants on the sites. Human impact was rated by the destruction of the land and if there were any types of manmade materials at the site. Exotic plants were identified and recorded at each site by people who knew the native plants. Then the plant information was logged into a computer so that the information could be analyzed and scored.
Figure 6 shows an example of the data that we collect. It shows the basic topography of Fowl Cay, which is an example of a non-altered cay. The line graph in this figure shows the varying heights of the terrain including the different zones. From the zero to the 15 meter mark is the pioneer zone, 15 to the 40 meter mark is the bluff, 40 meter to 45 meters is the ridge, 45 to 80 meters is the windward rocky bluff, and to the 90 meter mark is the rocky shore. The table is a record of the height of the points taken by the Zip level at each interval according to the height that was taken at the first point (in the figure, this is marked as 0.000; each meter mark coincides with the elevation of each point).
Topography of Fowl Cay
Figure 7 presents the rankings of each survey site. The ranking provided a quick tool for comparing sites over a month of survey work. The table lists each sites, the island the site is located, and the human impact score. In the figure, GREEN represents a low impact score, with RED indicating a severe human impact score. Of the 18 sites presented in Figure 7, ten sites received a ranking of “low,” two sites were ranked “medium,” two sites were ranked “high,” and two sites were ranked “severe”.
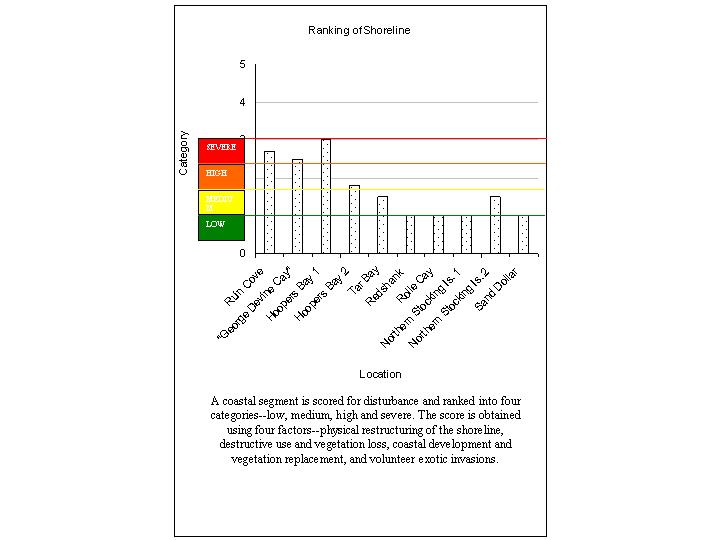
Survey Site Impact Ranking
CONCLUSIONS:
Great Exuma has a low human population density, but even a small number of people can have a significant impact on coastal ecology. There are destructive land use patterns in the Exumas that are impacting near shore marine resources. One of the most significant problems is lack of a coastal setback or vegetation. Houses, roads or construction sites are too close to the high water line, and no protective vegetation buffer is left in place.
The results confirm that coastal alteration not only affects the topography, but also allows for the invasion of exotic plant species, such as Australian Pines. Most exotic species that have already come to the island are able to grow much faster and thus are able to take over the altered environment. Destructive land development also directly affects the neighboring marine environment through development that either involves dredging or allows sedimentation from the land to seep into the sea.